
Let’s start with Sprint Planning…
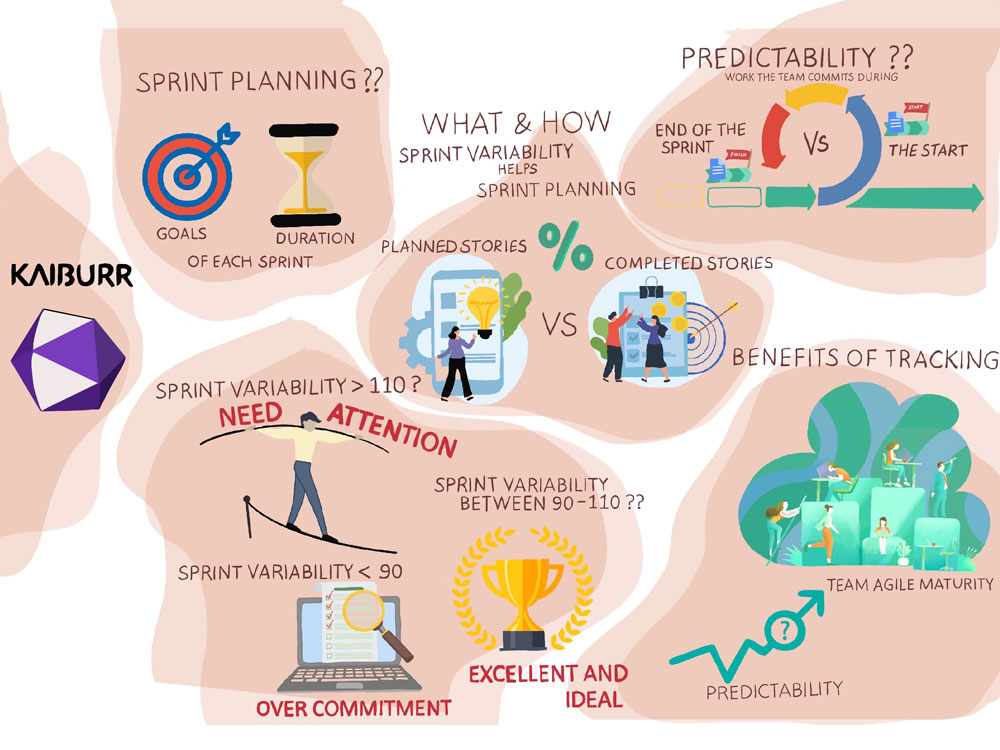
Before getting into Sprint Variability, let us review Sprint Planning in Agile. Sprint Planning is an Agile process that helps to decide the goal(s) and duration for each Sprint or Iteration. It’s the first Agile project activity, and if done right, sets the project and the organization for success.
“An hour of planning can save 10 hours of doing.”
Next, we’ll see the Predictability (Planned-to-Done Ratio)
Predictability helps both the Development Team and the Product Owner. Calculating the Planned-to-Done ratio is a simple exercise of measuring how much work the team commits to doing at the start of the Sprint versus how much they have completed at the end of the Sprint.
“The predictability of a Sprint can be improved by limiting the number of changes performed mid-Sprint.”
Ok, now let us see what and how Sprint Variability helps Sprint Planning…
Sprint Variability is the percentage that represents the comparison of the Planned Stories vs. the Completed Stories in a particular Sprint or collection of Sprints. It can also be calculated with Story Points and Efforts as below,
- Planned Stories vs. Completed Stories.
- Planned Story Points vs. Completed Story Points.
- Planned Efforts (in hrs) vs. Completed Efforts (in hrs)

Sprint Variability > 110%??? [Planning need attention]
When the number of completed stories at the end of the Sprint is more than the number of planned stories at the beginning of the Sprint, Sprint Variability is greater than 110% and indicates ‘Planning needs attention’. For example, If the planned stories at the beginning of the Sprint are 10 and the completed stories at the end of the Sprint is 14, then, per the equation above, the Sprint Variability is:
Sprint Variability 🡺 Completed Stories / Planned Stories (in %)
Sprint Variability 🡺 14 / 10 (in %)
Sprint Variability 🡺 140%

To avoid the Sprint Variability threshold going over 110%, the team must do better Sprint Planning and avoid adding stories/tasks after the Sprint has begun.
Sprint Variability 🡺 Completed Stories / Planned Stories (in %)
Sprint Variability 🡺 6 / 10 (in %)
Sprint Variability 🡺 60%

Sprint Variability < 90%??? [Over Commitment]
When the number of completed stories at the end of the Sprint is less than the planned stories at the beginning of the Sprint, Sprint Variability is lower than 90% and indicates ‘Over Commitment/Execution.
To avoid the Sprint Variability threshold percentage dropping below 90%, the team must commit to a realistic number of stories/tasks when doing Sprint Planning. Performance in past Sprints and known risks or uncertainties should be taken into account when planning Sprints.
Sprint Variability between 90 and 110 is excellent and is ideal…
Sprint Variability is Ideal when the number of completed stories at the end of the Sprint is the same (± 10%) as planned.
For example, the planned stories at the beginning of the Sprint are 10 and the completed stories at the end of the Sprint is 10, then as per the above equation, the Sprint Variability is:
Sprint Variability = Completed Stories / Planned Stories (in %)
Sprint Variability = 10 / 10 (in %)
Sprint Variability = 100%

There are many advantages in tracking Sprint Variability, the primary ones are listed below:,

- Predictability
Stakeholders can better predict the availability of features, and projects and initiatives and allow for further downstream planning and execution and support.
- Team Agile Maturity
Achieving optimal Sprint variability consistently helps build confidence, boosts team morale and pushes Sprint teams to work in a mature Agile process with predictable outcomes. This in turn builds high confidence in the ability of the team, in the minds of the stakeholders and leaders.
Kaiburr, with its intelligence scans through all the stories, calculates the Sprint variability of all the projects and Sprints.
Below is a sample Sprint Variability metric snapshot generated by Kaiburr.
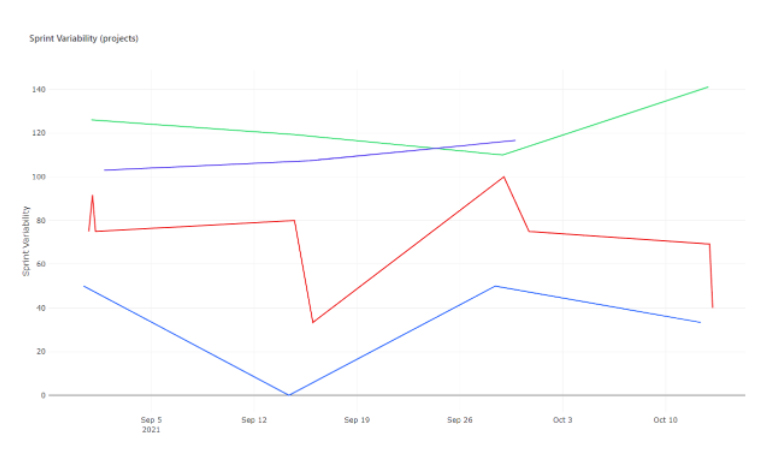
Doing this will help project and engineering leaders to proactively identify issues and resolve them early before they impact major milestones and customer commitments.
With just 15 minutes of configuration, Kaiburr produces real-time actionable insights on end-to-end software delivery with 350+ KPIs, 600+ best practices and AI/ML models. Kaiburr integrates with all the tools used by software product teams and generates digital insights with a sophisticated next-generation AI/ML driven engine.
Reach us at contact@kaiburr.com to get started with metrics-driven continuous improvement in your organization.